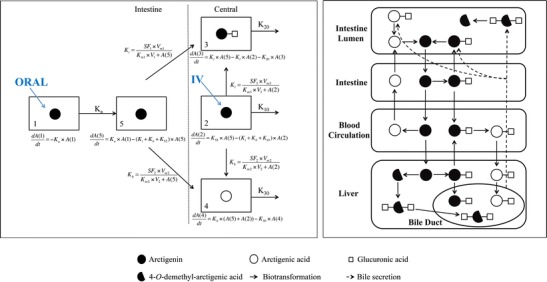
Fig. 2.

Proposed biotransformation diagram of arctigenin after various routes of administrations in rats. Dotted double line represents quantitative model used for fitting of the plasma concentrations of arctigenin and its metabolites (Oral oral administration; IV intravenous administration; K i, K b, K l metabolic constant in intestinal cells, blood, and liver, respectively; K 10, K 20, K 30 elimination constant of AR, AA, and AG from central compartment, respectively. Solid double line represents qualitative description of biotransformation of arctigenin based on in vitro and in vivo observations
