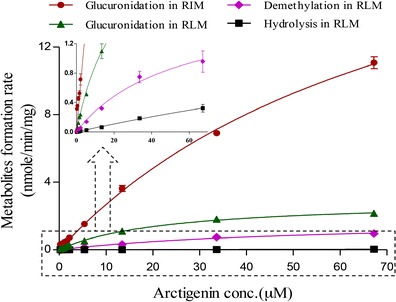
Fig. 3.

Metabolic kinetics profiles of arctigenin (0.269–67.2 μM) in rat intestinal (RIM) and liver microsome (RLM) (n = 3) Glucuronidation in RIM: 50 mM Tris–HCl buffer (pH 7.4), 0.05 mg/ml, 2 mM UDPGA 37°C, 10 min; glucuronidation in RLM: 50 mM Tris–HCl buffer (pH 7.4), 0.2 mg/ml, 2 mM UDPGA, 37°C, 15 min; hydrolysis and demethylation in RLM: 20 mM potassium phosphate buffer (pH 7.4), 0.2 mg/ml, 2 mM NADPH, 37°C, 2 h
