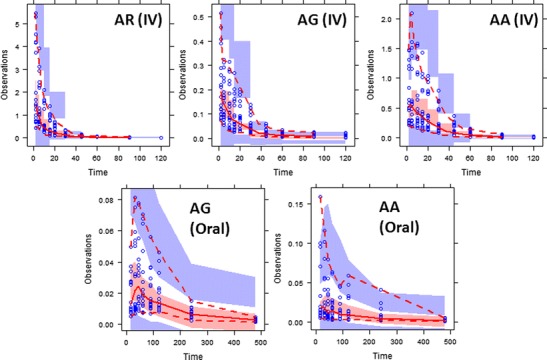
Fig. 7.

Visual predictive check (VPC) plots of the integrated PK model for arctigenin (AR) and its metabolites (AG and AA) after intravenous (IV) or oral administration. The gray-shaded areas represent the 95% confidence intervals of the corresponding 2.5th, 50th, and 97.5th percentiles of the simulated data; the red-dashed areas represent the 2.5th and 97.5th percentiles of the observed data; and red solid line represents median of the observed data
