
Figure 5.
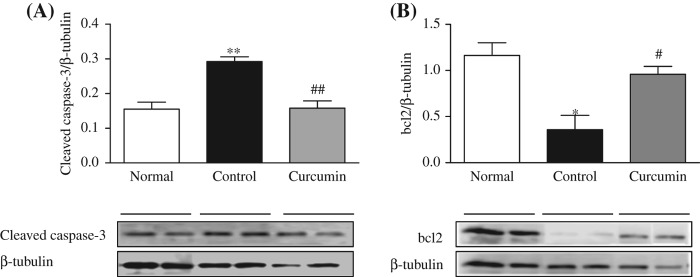
Hepatic expressions of cleaved caspae-3 and bcl2. Representative Western blots (lower panel) show specific bands for cleaved caspase-3 (A) and bcl2 (B); representative histograms (upper panel) show the band densities with relative β-tubulin. The blots are representatives of five independent experiments. Each bar represents mean ± SE. Normal, age-matched normal rats; Control, untreated diabetic rats; Curcumin, diabetic rats treated with curcumin 100 mg/kg/day. ∗p < 0.05, ∗∗p < 0.01 versus Normal, #p < 0.05, ##p < 0.01 versus Control.