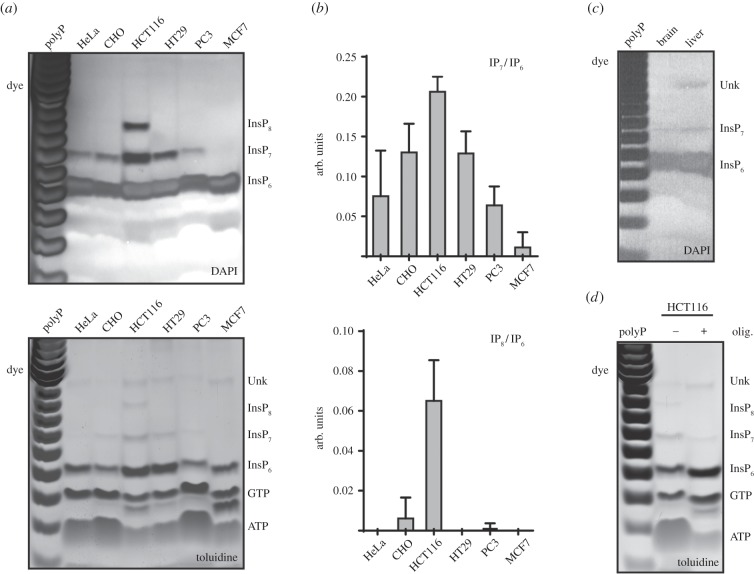
Figure 3.
Visualizing InsP6, InsP7 and InsP8 from mammalian cells and organs. (a) Cells from six different human lines were collected and washed in PBS. A small aliquot was taken for determination of protein concentration, while the rest was PA extracted and subjected to TiO2 bead enrichment. Extracts relative to equivalent amounts of protein for each cell line (approx. 35 mg) were loaded on two parallel gels subsequently stained by DAPI (top) and toluidine blue (bottom). (b) Densitometry of toluidine blue-stained gel from three independent experiments was used to calculate ratios of InsP7 and InsP8 over their precursor InsP6. (c) Mouse brain and liver (approximately 0.5 g) were homogenized and extracted with PA. After TiO2 purification the inositol phosphates were resolved by PAGE and stained with DAPI. (d) Two 14 cm dishes of 80% confluent HCT116 cells were pre-treated in glucose-free medium for 30 min before addition of 5 µM oligomycin for 3 h. The TiO2 extracts were then resolved by PAGE and stained with toluidine blue. The gels presented are representative of experiments performed three times.

