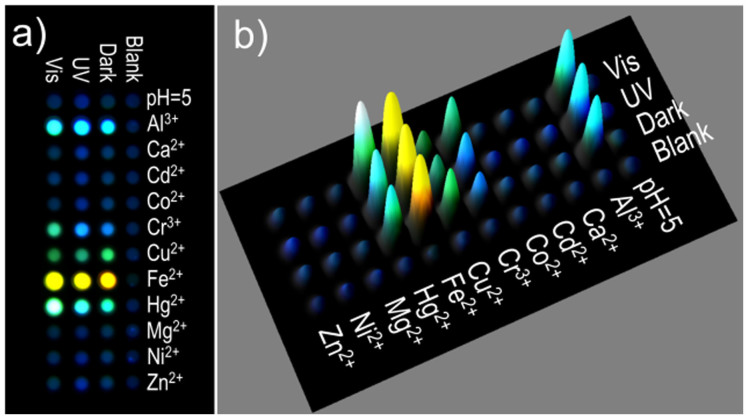
Figure 4.
(a) Fluorescent image and (b) 3D representation of the integrated fluorescence intensity of the photochromic SP microchip constitute from rows from each light irradiations process of the photochromic microchip. The Fluorescent image of photochromic microchip spotted by metal ions (1.0 mM in water, 200 nL), which was recorded in 6 different channels. The colours were generated by superimposing of the equally weighed images corresponding to RGB channels.

