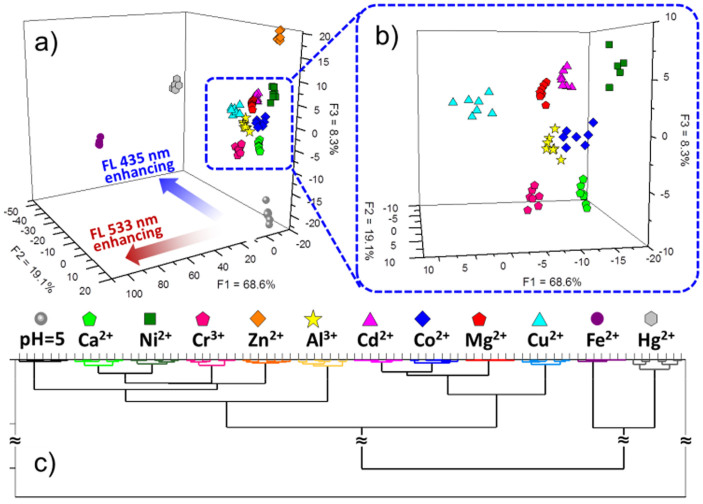
Figure 5. Fluorescent discriminant analysis of 11 metal ions on SP multi-states microchip and rational analysis.
(a, b) Graph of LDA result shows a clear clustering of the 11 metal ions analytes and its corresponding magnified image. LDA reflects analytes specific fluorescent enhancement at 435 nm or 533 nm due to various metal electropositivity. The gathering of the clusters demonstrates the good repeatability of the SP multi-states microchip for each metal ion response. (c) HCA gives the similarity clustering of the analytes based on the fluorescent variation trend of the spirooxazine-metallic coordination in three states.

