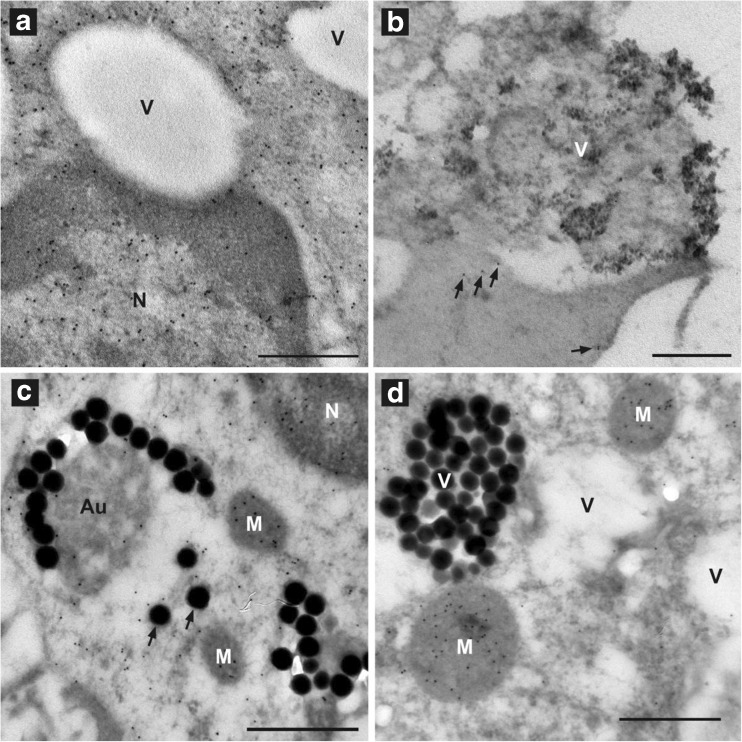
Fig. 5.
The distribution of GSH in PBMCs exposed to 10-nm or 100-nm SiO2 NPs is similar to that seen in PBMCs during oxidative stress (Ault and Lawrence 2003). a An unexposed control PBMC showing GSH (indicated by 10-nm gold-anti-mouse IgG) distributed throughout the nucleus (N) and cytoplasm, but not within vacuoles (V); bar indicates 0.5 μm. b A PBMC exposed to 10-nm NPs is shown with clumps of NPs in a vacuole (V) and NPs being taken up or exocytosed by the cell. GSH levels (indicated by the number of gold particles) are low compared with those in unexposed control PBMC in (a). Only five gold particles (arrows) are observed in the cytoplasm; bar indicates 0.5 μm. c A PBMC exposed to 100-nm NPs showing depletion of GSH (indicated by a few gold particles in the N and cytoplasm than in those of the unexposed PBMC in (a). GSH remains concentrated in the mitochondria (M). The 100-nm NPs are found in V and individually in the cytoplasm (arrows). The nonsilica material of an autophagolysosome (Au) has some labeling (gold particles) indicating the presence of GSH. This material may be that of autophagocytized mitochondria; bar indicates 0.5 μm. d A PBMC exposed to 100-nm NPs is shown with the cytoplasm being almost depleted of GSH (absence of gold particles). GSH still remains in the mitochondria (M) as previously observed with PMBC enzymatically depleted of GSH (Ault and Lawrence 2003); 100-nm silica particles are contained in a V; bar indicates 0.5 μm

