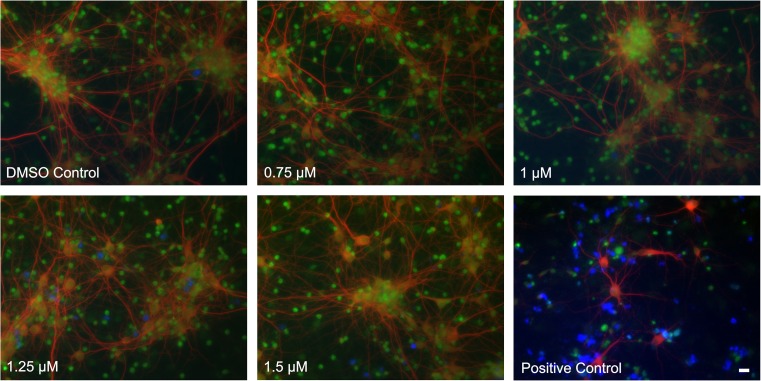
Fig. 2.
Effect of celastrol concentration on cell viability in cerebral cortical cultures. Cell viability effects were not detected at celastrol concentrations of up to 1.5 μM. Cell viability was assayed by CellTrace calcein (green) identifying live cells, MAP2, a marker for neuronal cellular processes (red) and dead cell stain (blue). Celastrol treatment at 3 μM was included as a positive control that resulted in the retraction of cellular processes (red), a decrease in the live cell signal (green), and an increase in dead cell signal (blue). Scale bar = 20 μM

