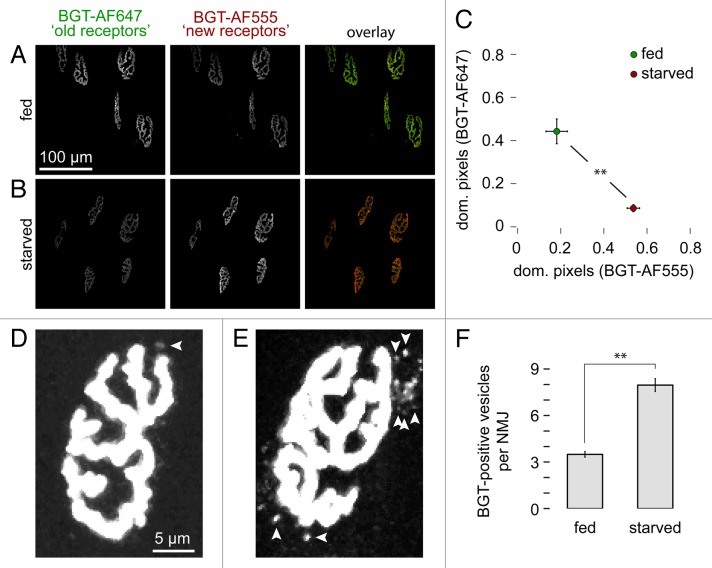
Figure 3. Starvation leads to increased CHRN turnover and enhances the amount of endo/lysosomal carriers containing CHRN at the NMJ. CHRNs in tibialis anterior muscles were labeled with BGT-AF647 (“old receptors”) after 48 h of starvation and 10 d later muscles were reinjected with BGT-AF555 (“new receptors”). Then, in vivo microscopy was performed and an automated algorithm determined the relative amount of pixels dominant for either “new receptor” or “old receptor” signals. The number of endo/lysosomal carriers containing CHRN was counted manually after electronically enhancing the signal using ImageJ. (A and B) Maximum z-projections of confocal stacks showing automatically segmented NMJs from fed (A) and starved (B) mice. In the overlay panels (right) old receptor and new receptor signals are shown in green and red, respectively. (C) Quantitative analysis. Graph depicts mean ± SEM of the relative amounts of pixels dominant for either new receptor or old receptor signals in each NMJ (n = 12 [293 NMJs] and n = 4 [106 NMJs] muscles for fed and starved conditions, respectively). **P < 0.01 according to the Welch test. (D and E) Maximum z-projections of NMJs from fed (D) and fasted muscles (E). Arrowheads indicate BGT-AF positive endo/lysosomal carriers. (F) Quantitative analysis. Graph depicts the average amount of BGT-positive vesicles per NMJ. Mean ± SEM (n = 6 and n = 3 muscles for fed and fasted conditions, respectively. 50 NMJs analyzed for each condition). **P < 0.01 according to the Welch test.

An official website of the United States government
Here's how you know
Official websites use .gov
A
.gov website belongs to an official
government organization in the United States.
Secure .gov websites use HTTPS
A lock (
) or https:// means you've safely
connected to the .gov website. Share sensitive
information only on official, secure websites.
