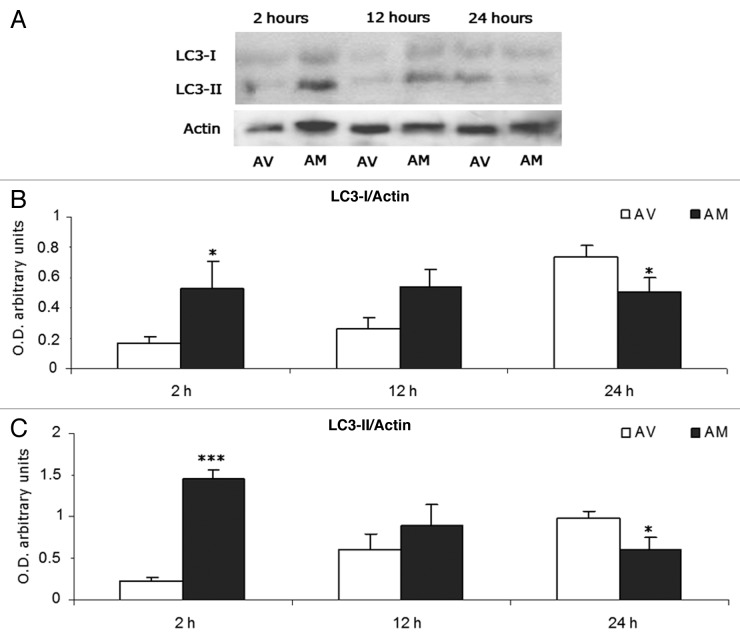
Figure 2. (A) Immunoblot analysis of LC3-I, LC3-II and actin expression in meat from AV and AM breeds along the postmortem period in the study (2 h to 24 h). (B) Semi-quantitative optical density (arbitrary units) of LC3-I expression normalized to actin. (C) Semi-quantitative optical density (arbitrary units) of LC3-II expression normalized to actin. Significant differences between breeds at a given aging time are expressed as *P < 0.05 and ***P < 0.001.

An official website of the United States government
Here's how you know
Official websites use .gov
A
.gov website belongs to an official
government organization in the United States.
Secure .gov websites use HTTPS
A lock (
) or https:// means you've safely
connected to the .gov website. Share sensitive
information only on official, secure websites.
