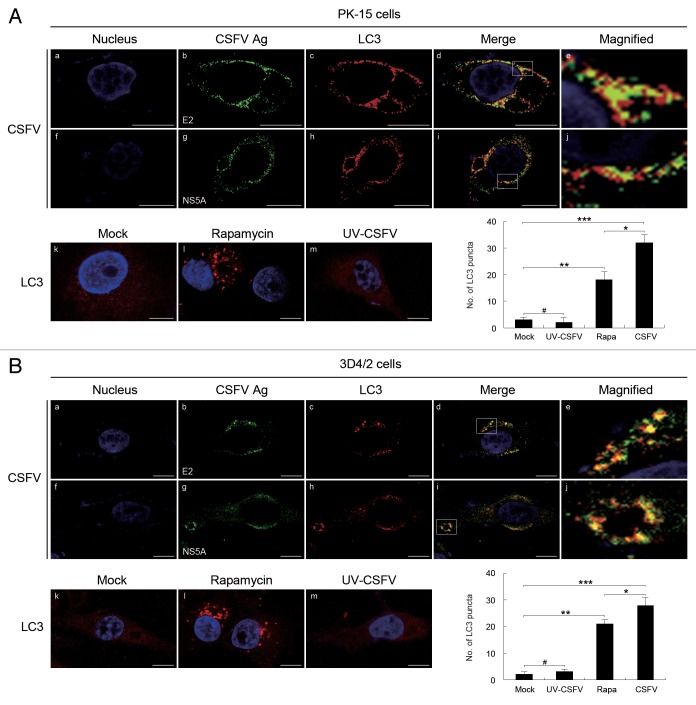
Figure 4. CSFV infection induces the redistribution of the autophagy marker LC3 in host cells. (A) PK-15 cells were mock-infected or infected with CSFV (MOI = 1) or UV-inactivated CSFV (MOI = 1) or treated with rapamycin (Rapa, 100 nM) for 48 h. The cells were then fixed and processed for indirect immunofluorescence using antibodies against LC3B and the CSFV proteins (E2 or NS5A), followed by the corresponding secondary antibodies conjugated to FITC and TRITC as described in Materials and Methods. The cell nucleus were counterstained with DAPI. The fluorescence signals were visualized by confocal immunofluorescence microscopy. In the images, the nucleus staining is shown in blue (a and f), E2 and NS5A staining is shown in green (b and g), LC3 staining is shown in red (c and h), and the signals of colocalization are shown in yellow in merged images (d and i). The higher magnification images are shown in (e and j) from the white-square frame-enclosed region in (d and i). The mock- and UV-CSFV-infected cells as well as the rapamycin treatment group were analyzed with anti-LC3B antibodies and used as the control groups (k–m). Scale bar: 10 μm. The average number of LC3 puncta in each cell was determined from at least 100 cells in each group. The data represent the mean ± SD of 3 independent experiments. Two-way ANOVA: *P < 0.05; **P < 0.01; ***P < 0.001; # P > 0.05. (B) 3D4/2 cells were infected and analyzed as in (A). Scale bar: 10 μm. The data represent the mean ± SD of 3 independent experiments. *P < 0.05; **P < 0.01; ***P < 0.001; # P > 0.05.

An official website of the United States government
Here's how you know
Official websites use .gov
A
.gov website belongs to an official
government organization in the United States.
Secure .gov websites use HTTPS
A lock (
) or https:// means you've safely
connected to the .gov website. Share sensitive
information only on official, secure websites.
