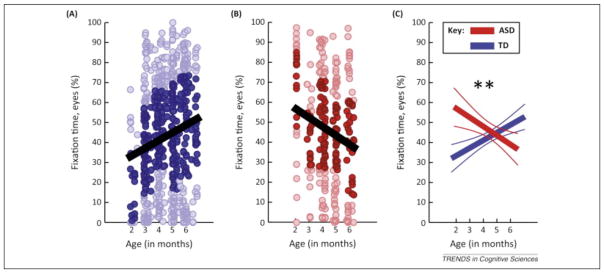
Figure 1.

Developmental patterns of fixation to the eye region of faces. (A) Raw data for eye fixations across age in a typically developing (TD) group (blue). (B) Raw data for eye fixations across age in a group that develops autism spectrum disorder (ASD) (red). (C) Hierarchical linear model (HLM) summary of data with mean trend lines and 95% confidence intervals, with significant interaction between diagnosis and age (P=0.002). From Extended Data Figure 2 in [1].
