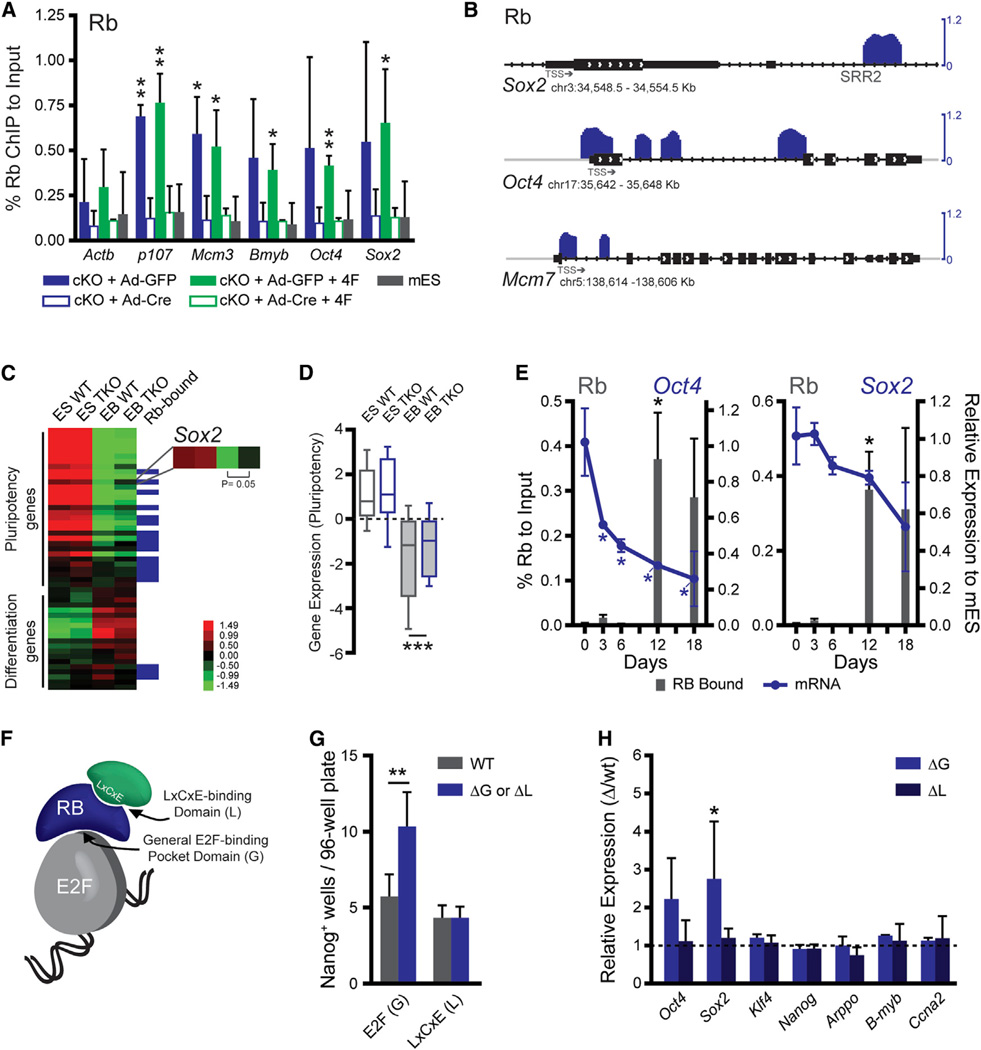
Figure 4. Rb Directly Binds Regulatory Elements in the Oct4 and Sox2 Loci.
(A) qPCR of Rb ChIP in Ad-GFP-infected cKO MEFs compared to Ad-Cre-infected MEFs and the mESCs as negative control. Primers are to the proximal promoter (Table S4). Significance was assessed by an unpaired t test to the average of the Ad-Cre-infected MEFs, including the mESC sample (n = 2).
(B) Rb (blue) binding at Sox2, Oct4, and Mcm7. Enrichment is shown as the log2 value of the fold change between normalized ChIP and the input samples (n = 2). The transcription start sites (TSS) are noted.
(C) Gene expression by microarray of WT and TKO mESCs after their differentiation into embryoid bodies (n = 3). Pluripotency genes (Figure S4D) and a selection of differentiation markers from endoderm, mesoderm, ectoderm, and trophectoderm are shown. These are also scored for their status as direct Rb targets.
(D) The average expression of the pluripotency genes shown in (C). Plots show the mean (horizontal line), the 25th to the 75th percentile (box), and the extent of the data (bars). Significance was tested by a paired t test.
(E) Rb ChIP in mESCs (d0) and after their subsequent differentiation into EBs (d3, d6, d12, and d18). Binding is shown (gray bars, left axis) as percent input normalized to a control locus to further account for cell number. Expression from the locus (either Oct4 or Sox2) is shown relative to the levels in the mESCs (blue line, right axis). Significance was determined by an unpaired t test to the respective d0 values for the ChIP and qPCR sets.
(F) Schematic of Rb interaction surfaces including the general E2F binding surface (G) and the LxCxE-binding domain (L), which interacts with other silencing factors.
(G) Reprogramming efficiency of the ΔG or ΔL mutant MEFs compared to those derived from a wild-type littermate. Efficiency was screened by AP and Nanog staining. Significance was determined by a paired t test.
(H) Gene expression in the ΔG and ΔL MEFs compared to wild-type MEFs as assessed by RT-qPCR. Expression is graphed as the relative expression of the mutant to the wild-type. Statistical significance was determined by a paired t test of the ΔCt values.
All plots, unless noted, display the mean ± SD where *p < 0.05, **p < 0.01, and ***p < 0.001. See also Figure S4.

