
Figure 6.
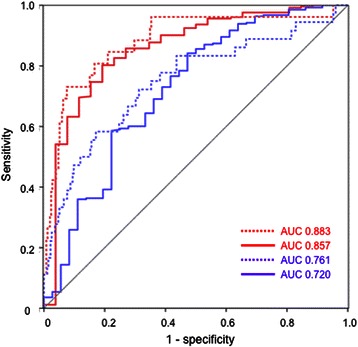
Receiver Operating Characteristic (ROC)-analyses regarding bias CIt-CIpc exceeding ≥15%. Solid lines represent predictuion by CIpc-CItd(base), dashed lines are derived from a multivariate model including changes in CIpc-CItd(base) and in dPmax in the evaluation-collective. Red lines: Evaluation-collective. Blue lines: Validation-collective. CItd: Thermodilution-derived Cardiac Index. CIpc: Pulse-contour-derived Cardiac Index. CItd(base): Cardiac index measured at previous (baseline) thermodilution.