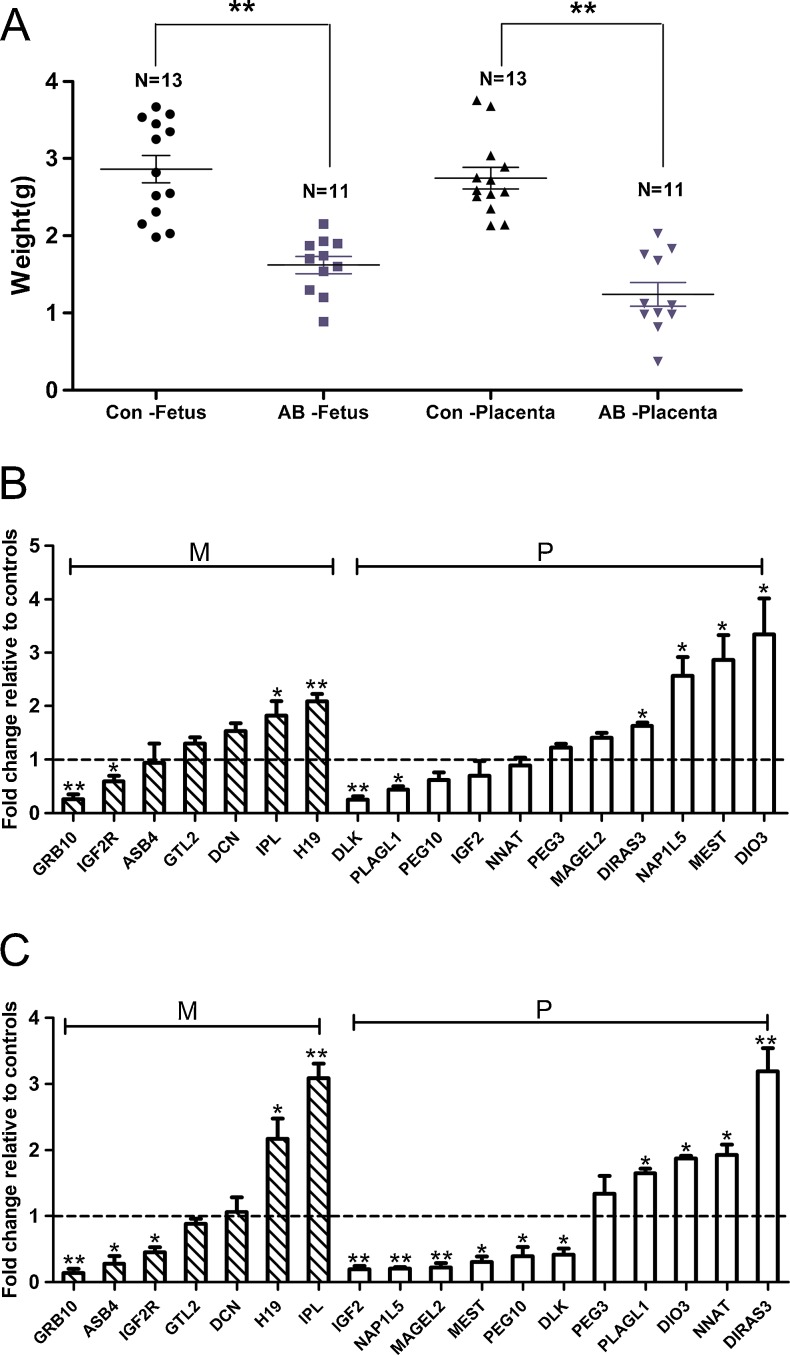
Fig. 1.
Weight comparison and relative expression levels of 18 imprinted genes. A: Weight comparison between the aborted cloned pigs and controls. Con, control, AB, aborted. Different shapes represent different samples. N represents the number of collected fetuses or placentas. B: The relative mRNA levels of 18 imprinted genes in aborted cloned porcine fetuses analyzed by quantitative real-time PCR. C: The relative mRNA levels of 18 imprinted genes in aborted porcine placentas analyzed by quantitative real-time PCR. M, maternal, P, paternal. The hyphenated lines (set as 1) represent the average expression level of each gene compared to the controls. Three repeats were performed for each sample. The values are presented as the mean ± S.E.M. *p < 0.05, **p < 0.01

