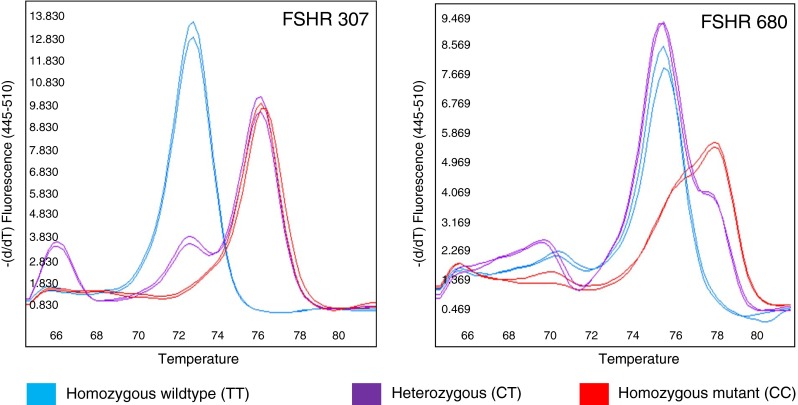
Fig. 2.

CADMA-based assays for FSHR genotyping. The negative derivative melting profiles of the two FSHR assays are shown. Based on the primer design, the amplicons have genotype-specific nucleotide content, resulting in three distinct melting curve profiles: (blue) homozygous wild-type (TT), (purple) heterozygous (CT), (red) homozygous mutant (CC)
