Figure 5.

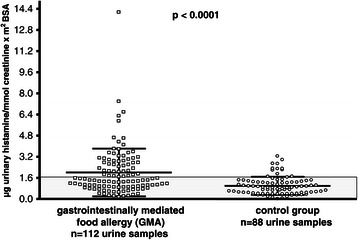
Distribution of individual urine histamine (UH) values during unrestricted diet in 56 patients with gastrointestinally mediated allergy (GMA) and 44 controls. The grey box represents normal values of UH (mean ± 1 SD of controls).

Distribution of individual urine histamine (UH) values during unrestricted diet in 56 patients with gastrointestinally mediated allergy (GMA) and 44 controls. The grey box represents normal values of UH (mean ± 1 SD of controls).