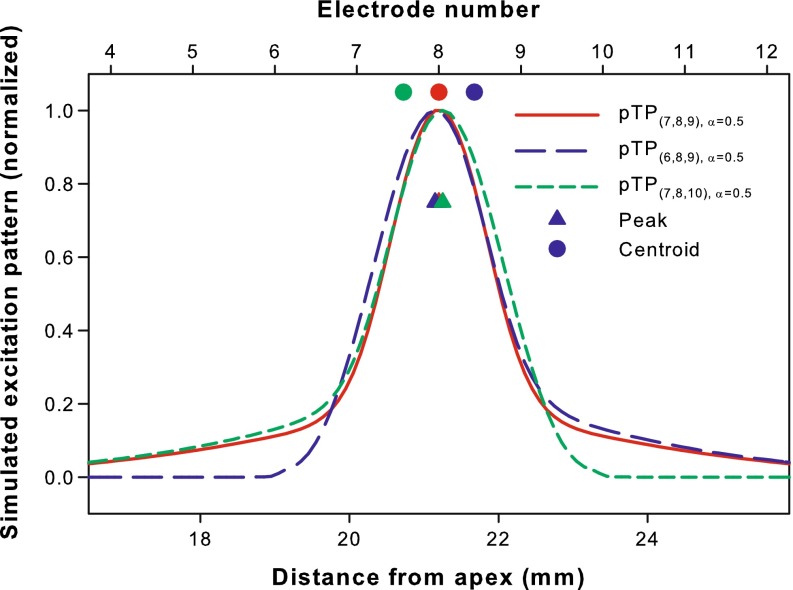
FIG. 2.
Simulated neural excitation patterns for pTP(7,8,9), α = 0.5 (red curve), pTP(6,8,9), α = 0.5 (blue curve), and pTP(7,8,10), α = 0.5 (green curve). The number of activated neurons is normalized and shown as a function of the distance from the apex of cochlea (bottom abscissa) or electrode number (top abscissa). For each pTP mode, the centroid (circle) and peak (triangle) of excitation are shown in the corresponding color. The compensation coefficient σ is fixed at 0.75 for all the simulations.

