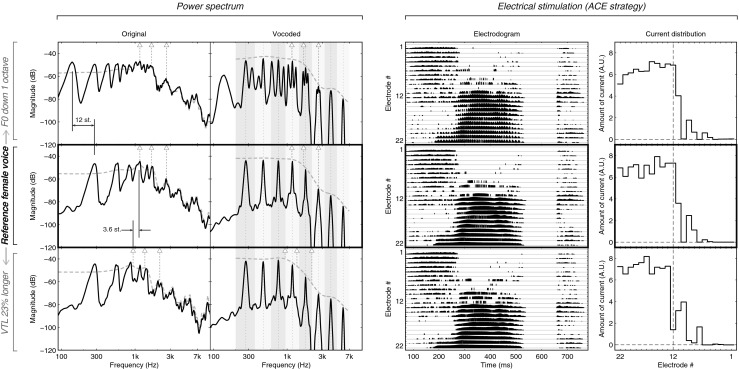
FIG. 1.

Power spectrum, waveform, and electrodogram of the vowel/aa/in “Vaak.” A different voice is represented per row. The stimulus resynthesized with the original parameters of the female voice is shown in the middle row. The top row shows the F0 changes only, by an octave down. The bottom row shows the VTL changed to be made 23 % longer, which results in shifting all the formants down by 3.6 semitones (st). The left panel shows, over the duration of the vowel, the spectra, for the non-vocoded (left column, noted “Original”) and vocoded (right column) versions of the stimulus. The spectrum itself is shown by the solid black line, visualizing the harmonics and/or the sinusoidal carriers of the vocoder. The spectral envelope is represented by the dashed gray line as extracted by Straight for the non-vocoded sounds on the left and as an interpolation between the carriers for the vocoded sounds on the right. The locations of the first three formants, based on a visual inspection of the envelope, are pointed out by the triangles and stems, for both the left and the right columns. The analysis filter bands of the vocoder are shown in the gray areas in the right column, whereas the sinewave carrier’s frequency is shown with a dotted line. The right panel shows the electrical stimulation as obtained with the Nucleus Matlab Toolbox (v4.31, Cochlear Limited, Australia) using an ACE strategy with a default frequency map. The left column shows the electrodogram for the whole word, while the right column shows the total amount of current per channel accumulated over the duration of the vowel. The vertical dashed line in this column locates the middle electrode.
