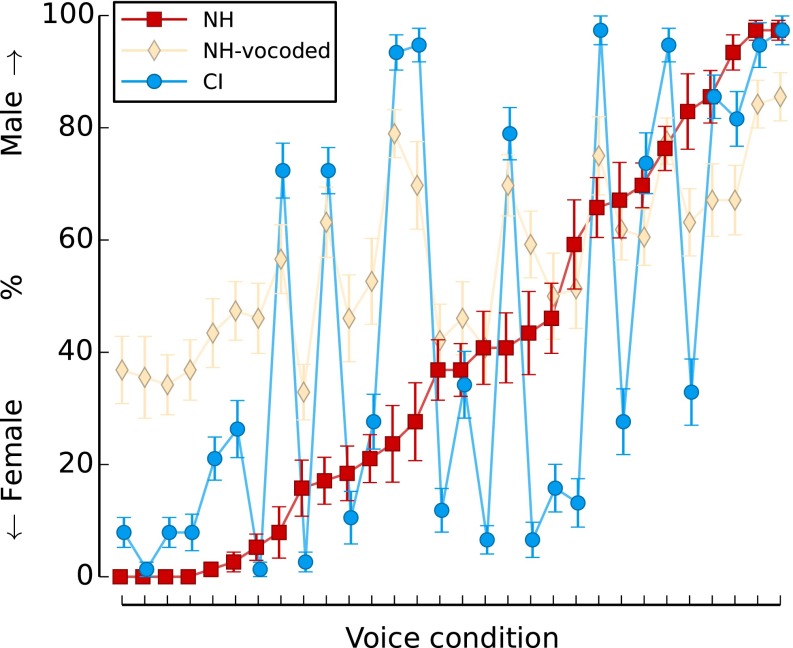
FIG. 2.
Gender categorization results of NH listeners (red squares), NH listeners tested with vocoded stimuli (CIsim, yellow diamonds), and CI users (blue circles). The x-axis represents the 30 voice conditions ordered according to the NH listeners’ average gender categorization, from female on the left to male on the right. The circles and diamonds show the data for the actual and simulated CI listeners for the same voice conditions. The error bars represent the standard error.

