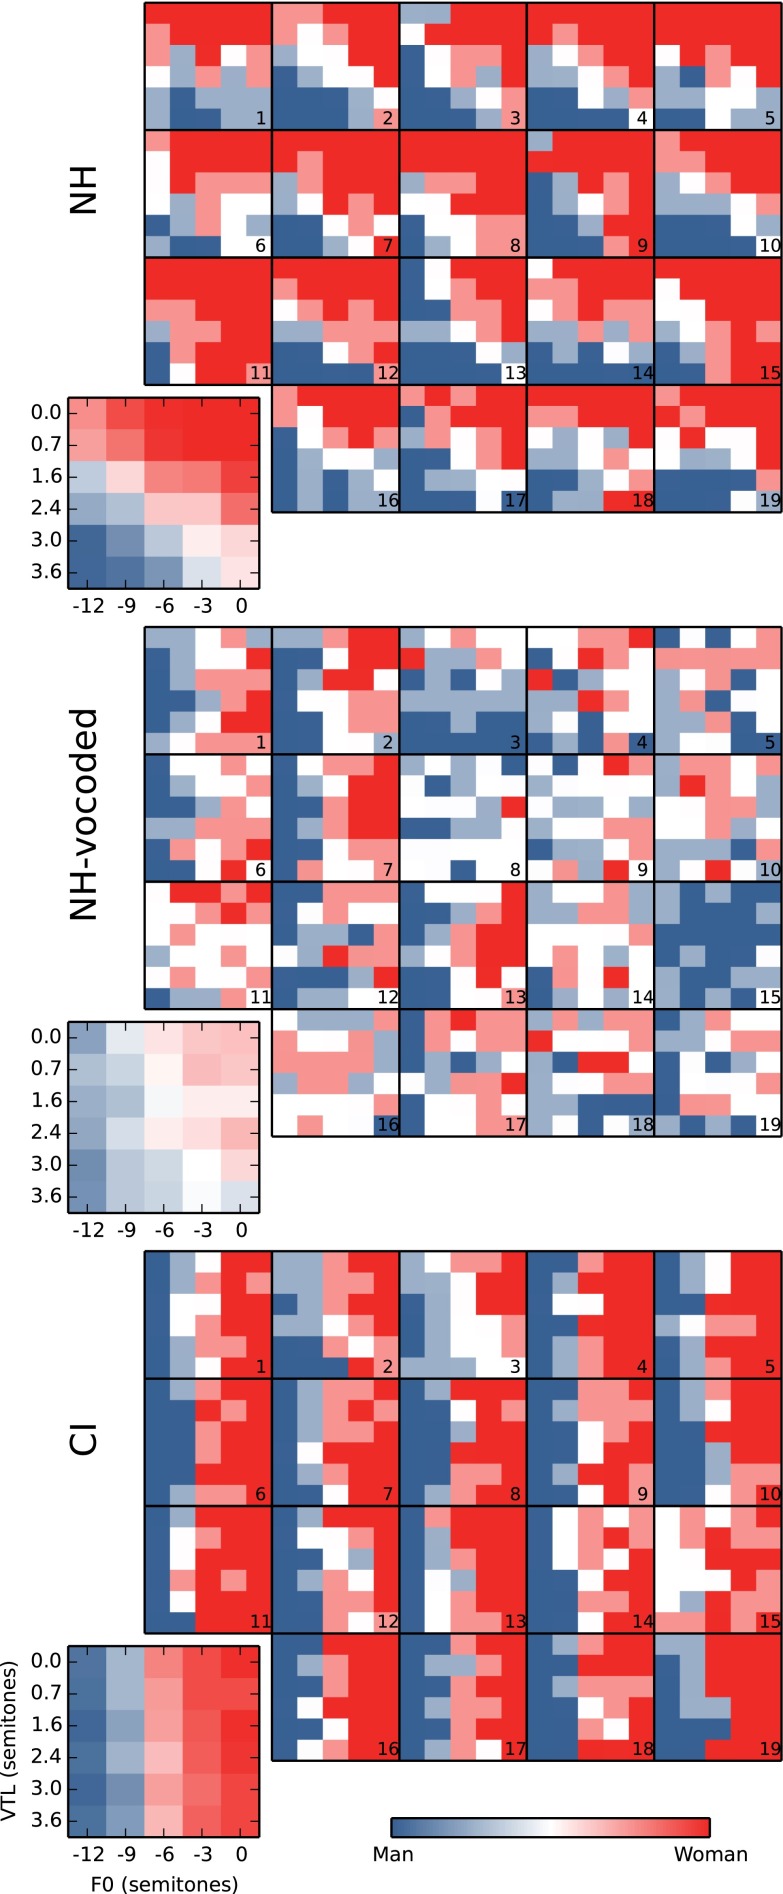
FIG. 3.
Individual and average gender categorization judgments, presented as maps in the F0–VTL plane. For each mode of hearing, the smaller panels numbered 1 to 19 show the individual maps where each pixel corresponds to a combination of F0 and VTL, while blue corresponds to 100 % “man” responses and red corresponds to 100 % “woman” responses.

