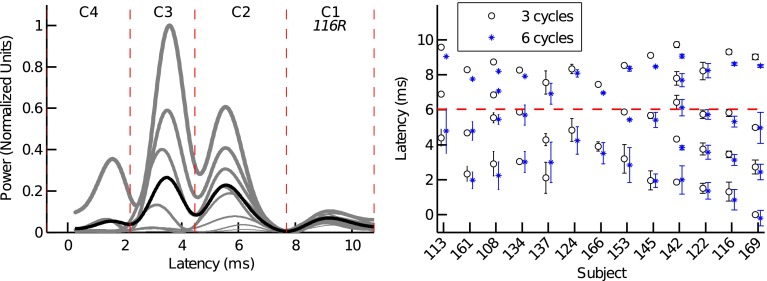
FIG. 3.
Different latency components in the 3- and 6-cycle TBOAEnl. The left panel illustrates how different latency components (i.e., C1, C2, C3, and C4) were defined (data is shown for the 3-cycle TBOAEnl from subject 116R). Gray lines are the TBOAEnl envelopes evoked for different stimulus levels (denoted by line thickness). The black line is the mean envelope from which the time boundaries of the different latency components were defined (indicated by the dashed lines). The right panel plots the mean latencies (±1 standard deviation) of the different latency components identified in the 3- (circles) and 6-cycle (asterisks) TBOAEnl, for all subjects. In some cases, the standard deviations were sufficiently small that error bars are not apparent. The horizontal dashed line is at a latency of 6.03 ms and was the latency boundary chosen for separating SL from LL components.

