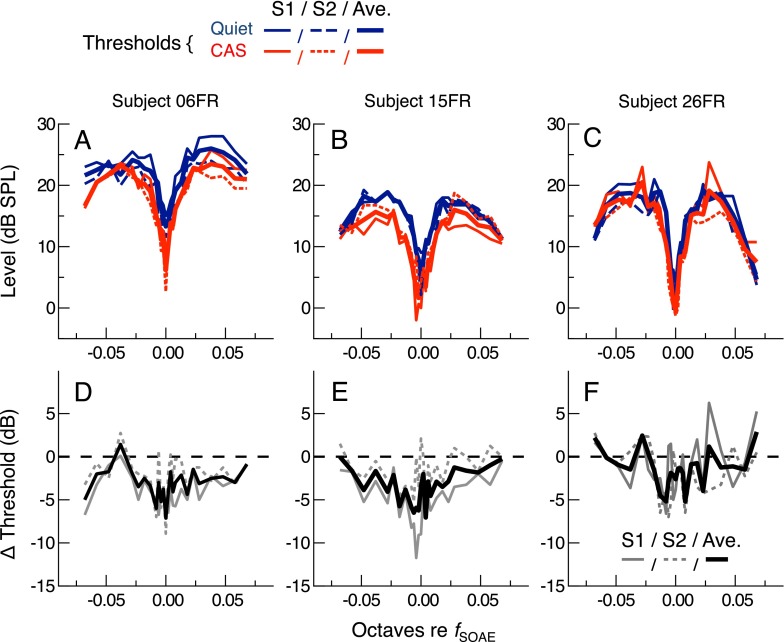
FIG. 4.
Threshold curves from the three subjects in Figure 3 replotted to minimize the effect of the frequency shift in the fine structure pattern. A–C Thresholds for each session (thin and dashed lines) and the two-session average (thick lines) are plotted as a function of the frequency distance from the SOAE frequency measured in the same condition (quiet or CAS), such that all curves are aligned relative to their minima. D–F CAS-mediated changes (CAS-quiet) in the aligned threshold curves are shown for each session (thin and dashed lines) along with their average (thick lines).

