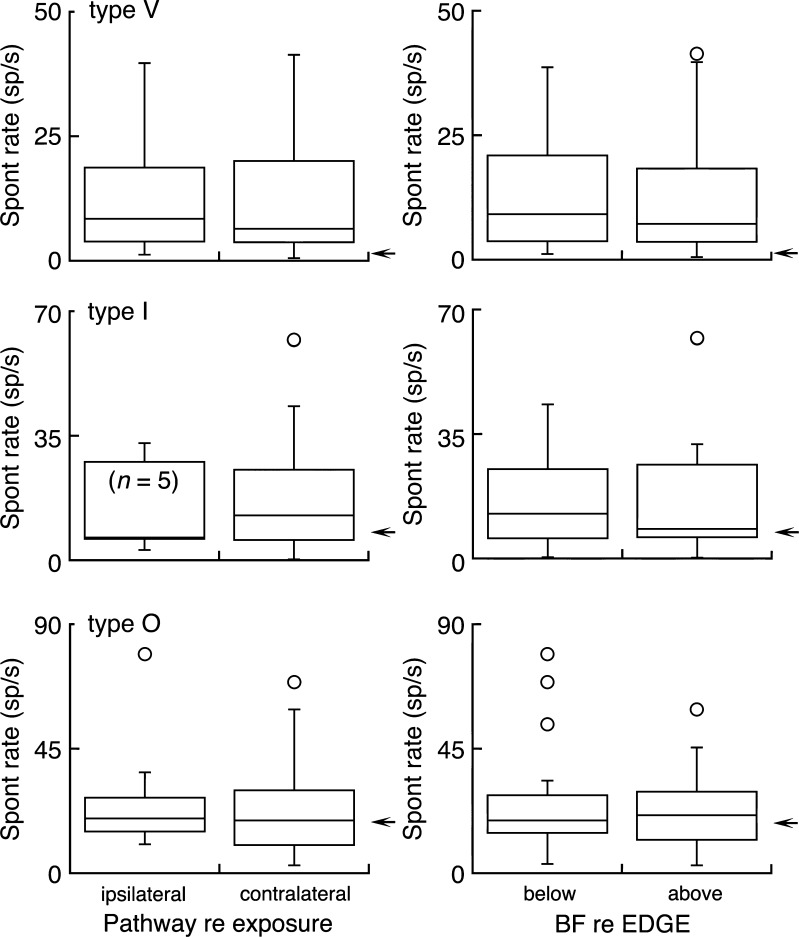
FIG. 5.
Regionalized effects of acoustic trauma. Box plots compare spontaneous activity in the ipsilateral and contralateral inferior colliculus of sound exposed rats (left) and at frequency regions below and above the EDGE of threshold shift (right). Arrows indicate median SR of unexposed units from the same response type.

