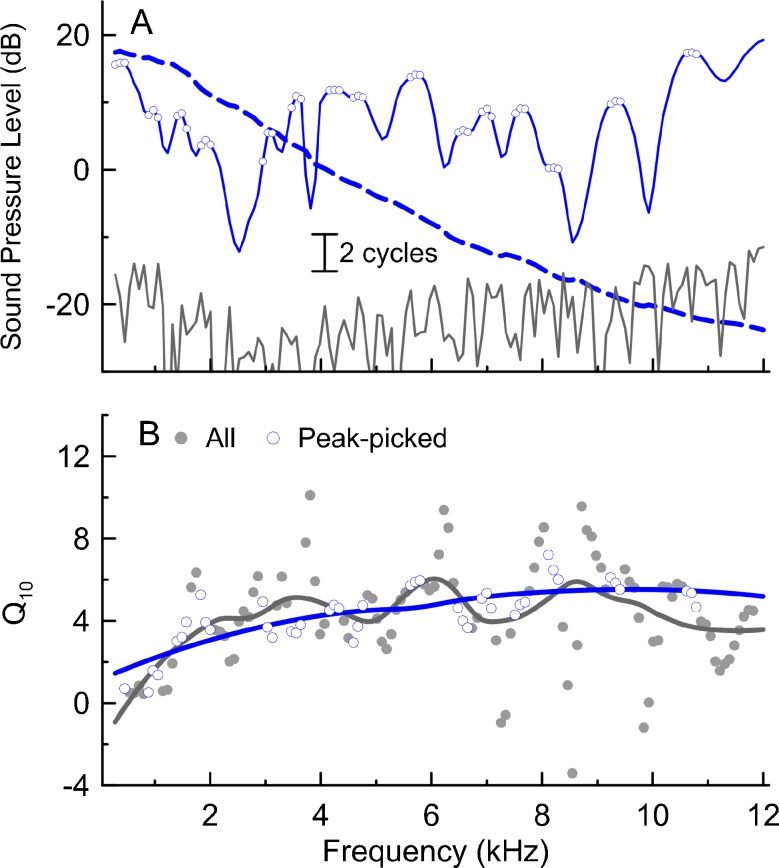
FIG. 1.
A method for deriving Q 10 from SF-GDs. A High-resolution SFOAE levels (blue line, smoothed with a Savitzky-Golay filter) with the level peaks (±1 point around) marked with open blue symbols and the corresponding unwrapped SFOAE phase (dashed line). The noise level is shown in gray. B Q 10 (circles) derived from SF-GDs (calculated from the slope of phase vs frequency curve shown as the dashed blue line in A) together with LOESS fits (unprocessed data in gray and data selected with the peak-picking strategy in blue, see Data analysis).

