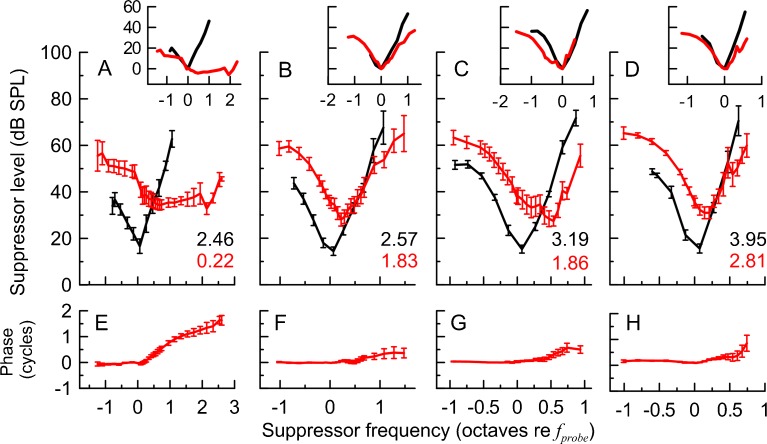
FIG. 2.
Average SF-STCs (red) and CAP-STCs (black) calculated only for animals with data for both measurement types at 1 kHz (A, n = 13), 4 kHz (B, n = 14), 8 kHz (C, n = 13), and 12 kHz (D, n = 10). The Q 10 values for the average STCs are shown in each panel. The error bars denote ±1 standard error. The insets in A–D show average STCs normalized to the suppressor level and frequency at their minima, with the exception of the average 1-kHz SF-STC that was arbitrary shifted so that its low-frequency side best matches the low-frequency side of the CAP-STC. Scaling of the y-axes (suppressor level in dB re tuning curve minimum) is identical for all the insets. The x-axes of the insets denote the suppressor frequency in octaves re f sup at the tuning curve minima. The bottom panels (E–H) show average SFOAE residual iso-response phase curves paired with the average SF-STCs in the upper panels. Prior to averaging the SFOAE, residual phase curves were unwrapped and normalized to the phase value at the f sup just below f probe to avoid effects of intersubject differences in absolute phase.

