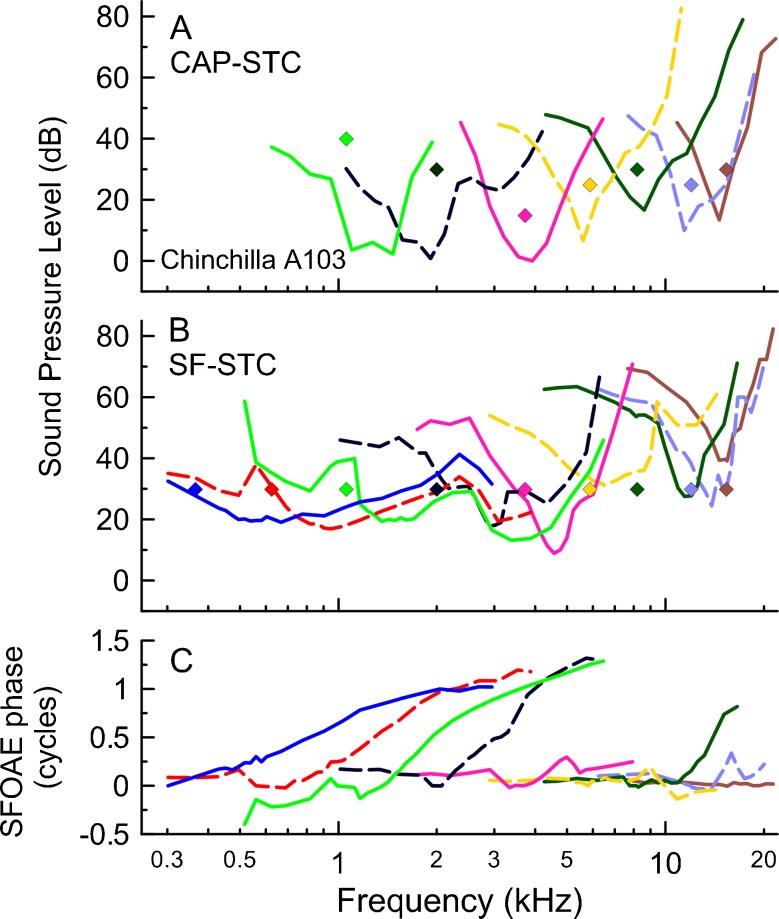
FIG. 3.
The CAP-STCs (A) and SF-STCs (B) with their corresponding SFOAE residual iso-response phase curves (C) for chinchilla A103. The diamonds mark the probe frequency and level. The curves collected at the same probe frequency are plotted in identical colors across the three panels. The CAP-STCs were typically not measured for f probe < 700 Hz due to technical difficulties (e.g. energy splatter of the tone burst, poorer CAP synchronization).

