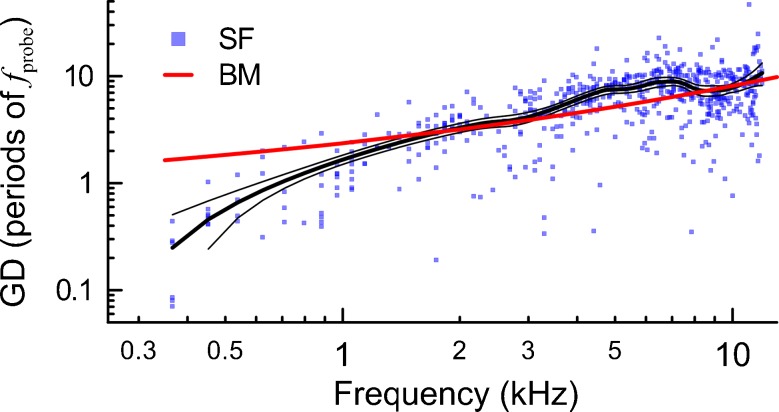
FIG. 4.
The SF-GDs were calculated with a peak-peaking strategy for measurements obtained with 30 dB SPL probe levels in 13 chinchillas (blue squares). The LOESS trend line (black thick line) with a 95 % confidence interval (calculated via bootstrapping; black thin lines) is shown to guide the eye. The average BM group delays for chinchillas is shown in red (as in Siegel et al. 2005).

