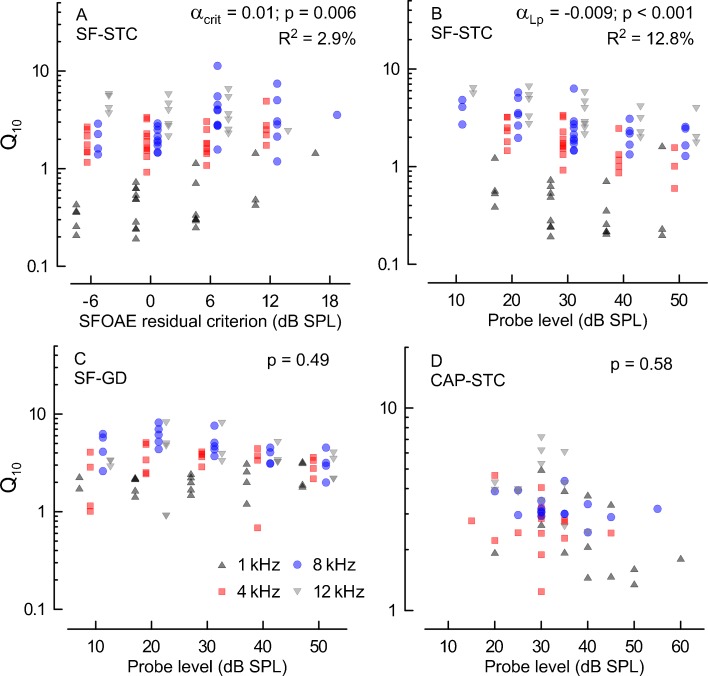
FIG. 6.
The effects of measurement conditions on Q 10 for probe frequencies of 1 kHz (black triangles), 4 kHz (red squares), 8 kHz (blue circles) and 12 kHz (gray triangles). A Q 10 for SF-STCs collected at varying SFOAE residual criteria (x-axis) with probe level fixed at 30 dB SPL. B, C Q 10 derived from SF-STCs (criterion of 0 dB SPL) and from SF-GDs for probe levels ranging from 10 to 50 dB SPL (in 10 dB steps; x-axis). D the subset of CAP-STCs Q 10 reproduced from Fig. 5 as a function of the probe level. The symbol shape and color denotes the probe frequency (see the legend in C). The data for different frequencies in A–C are plotted slightly offset along the x-axis to reduce overlap. The Q 10 (on a log scale) data were fitted with a linear regression model that included frequency and either residual criterion (A) or probe level (B–D) as explanatory variables (note: interaction terms were not significant in any case). The estimates of slopes (α) and their contribution to R 2 (if significant) for the x-axis variable are shown on each panel.

