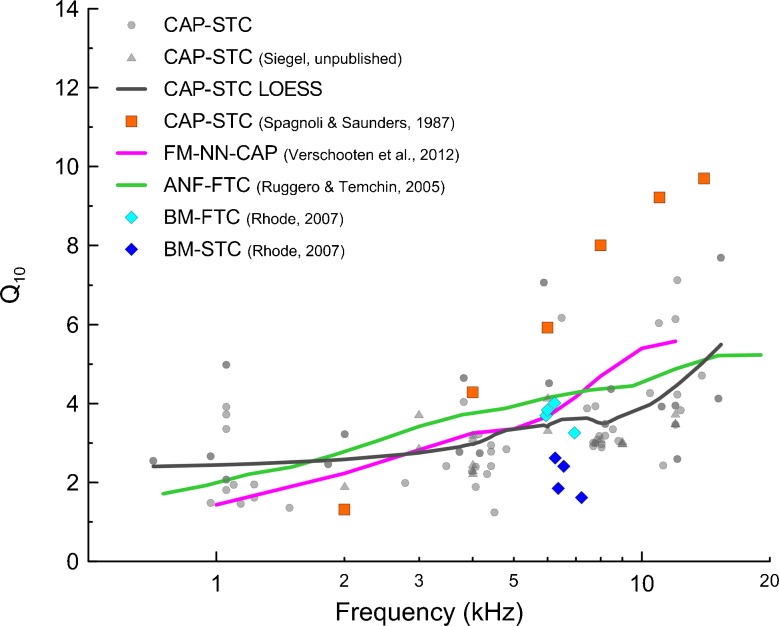
FIG. 7.
Sharpness of tuning (Q 10) derived from simultaneous masked CAP tuning curves [gray circles: data from this study, gray triangles: unpublished data of Siegel from two chinchillas collected with the same methods as described here, gray solid line: LOESS trend, span 0.7; orange squares: data from (Spagnoli and Saunders 1987) as shown in (Ruggero and Temchin 2005)]. Forward-masked CAP curves obtained with a notched-noise paradigm for a low-level fixed probe using a 33 % (3.5 dB) N1-P1 amplitude decrement criterion are shown in magenta (Verschooten et al. 2012). The Q 10 values for auditory nerve fiber frequency threshold tuning curves are shown in green (Ruggero and Temchin 2005). FTCs represent the level of tone needed to increase the response of a nerve fiber by some criterion amount (e.g. by 20 spikes/s above the spontaneous rate) as a function of frequency. The diamonds represent Q 10 extracted from basilar membrane tuning curves (from Fig. 15 in Rhode 2007): frequency threshold tuning curves for 1 nm displacement criterion in cyan and suppression tuning curves for 1 dB decrement criterion for probe level fixed at 30 dB SPL in blue. All data were obtained in chinchillas.

