
Figure 1.
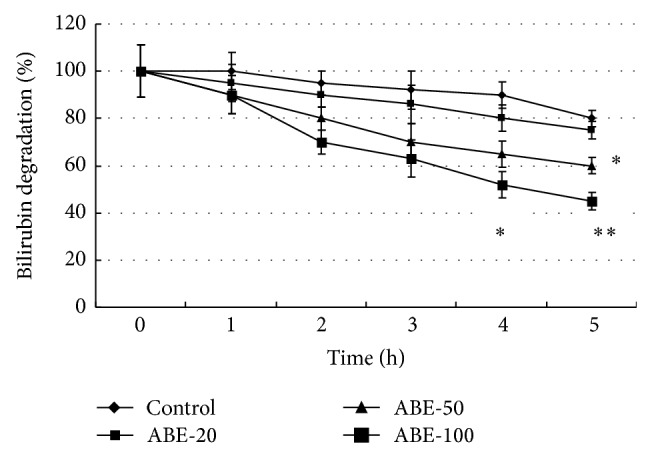
Comparison of in vitro efficacy of bilirubin degradation between different concentrations of ABE. Values are shown as means ± SEM. * P < 0.05 versus control group, ** P < 0.01 versus control group.
Official websites use .gov
A
.gov website belongs to an official
government organization in the United States.
Secure .gov websites use HTTPS
A lock (
) or https:// means you've safely
connected to the .gov website. Share sensitive
information only on official, secure websites.
Comparison of in vitro efficacy of bilirubin degradation between different concentrations of ABE. Values are shown as means ± SEM. * P < 0.05 versus control group, ** P < 0.01 versus control group.