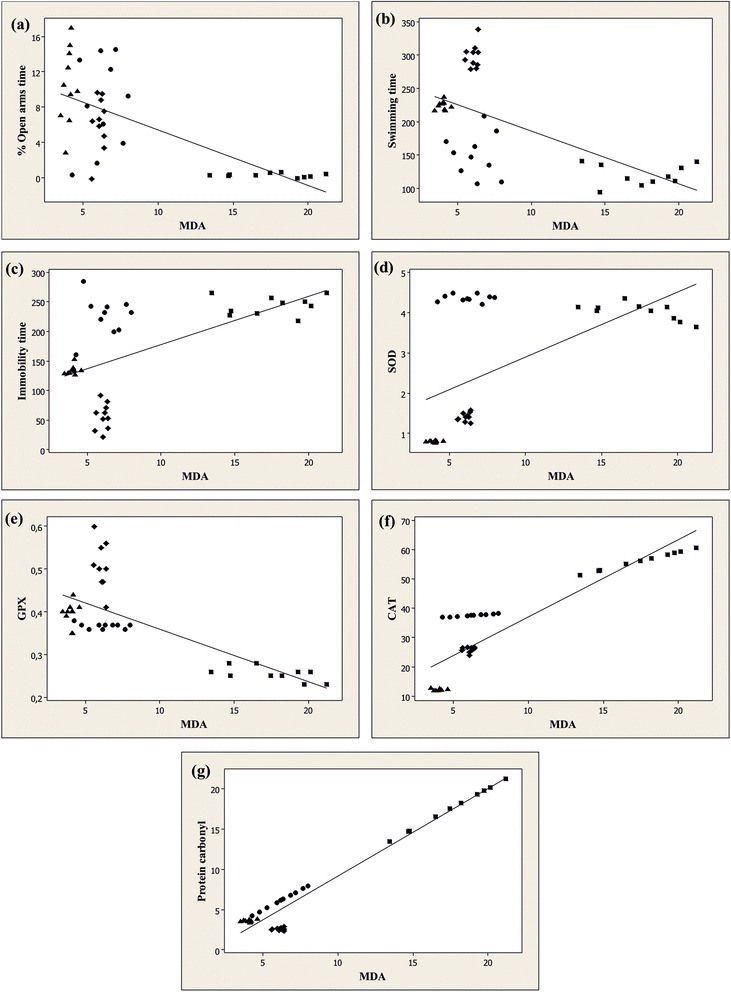
Figure 5.

Pearson’s correlation between the percentage of the time spent in the open arms vs. MDA (a), swimming time vs. MDA (b), immobility time vs. MDA (c), SOD vs. MDA (d), GPX vs. MDA (e), CAT vs. MDA (f) and protein carbonyl vs. MDA (g) in control group (●), Aβ (1–42) alone treated-group (■), Aβ (1–42) + P50 group (♦) and Aβ (1–42) + P100 group (▲).
