
Figure 2.
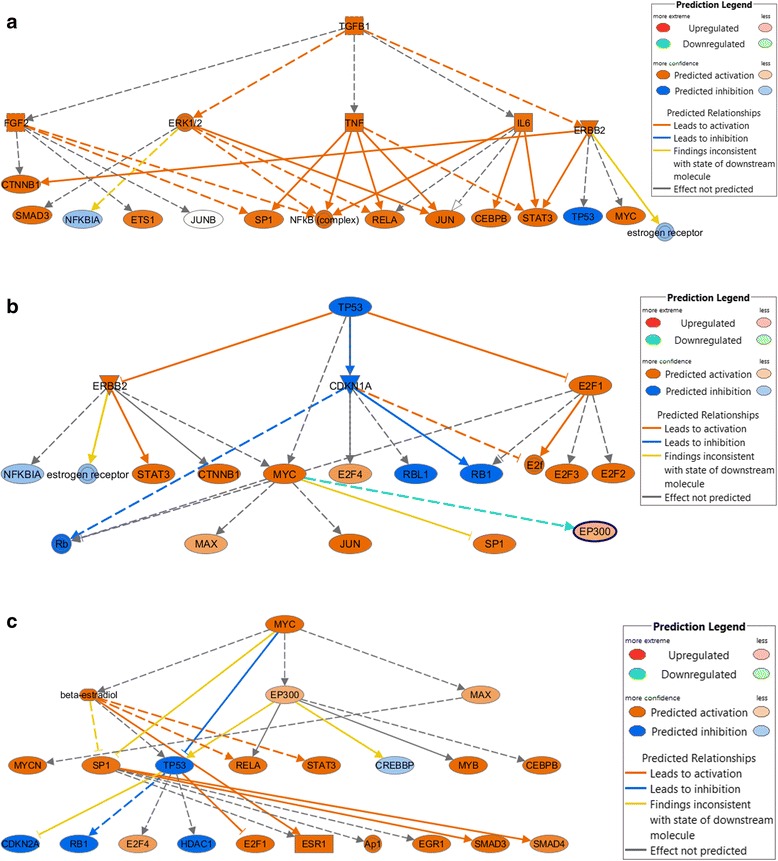
Major upstream regulators, TGFB1, MYC, and TP53 enriched by differentially expressed genes in our dataset. (a) TGFB1 upstream regulator of networks where the gene enrichment P values for differential expression was highly significant. (b) MYC primary upstream regulator of networks where the gene enrichment P value for differential expression was highly significant. (c) TP53 primary upstream regulator of networks where the gene enrichment P value for differential expression was highly significant.