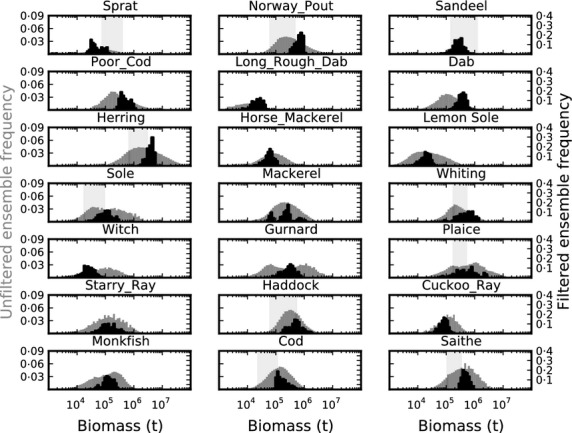
Fig 1.

Frequency distribution of estimated biomass of modelled species at FMSY. Grey histograms denote the frequency distribution of biomass estimates from models in the unfiltered ensemble (UE), black histograms the biomass estimates from models in the filtered ensemble (FE). The vertical shaded band represents the biomass range reported by ICES for assessed species for years 1990–2010.
