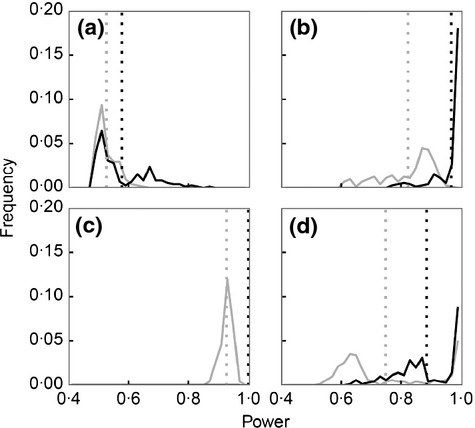
Fig 5.

Frequency distributions for the predicted power of the North Sea International Bottom Trawl Survey (IBTS) to detect modelled changes in the values of community metrics for all demersal fishes (Lifetype D1, Table 1) when fishing mortality is reduced from FHIST to FMSY over 5-year (grey) and 15-year (black) periods. Metrics are (a) mean length, (b) proportion of large fish, (c) size spectrum slope and (d) mean maximum weight. Vertical lines denote mean power for all model variants in the filtered ensemble (FE).
