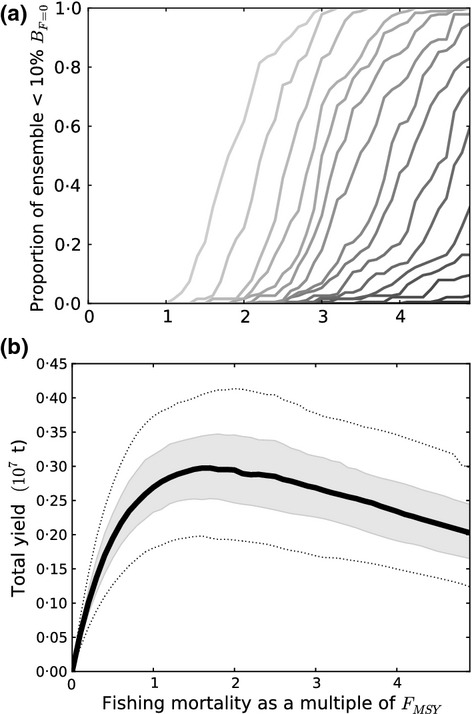
Fig 6.

(a) Probability of species' collapse as a function of fishing mortality, with probability expressed as the proportion of variants in the filtered ensemble (FE) which result in collapses (B < 10% B0). The lightest grey tone indicates probability for the most sensitive species and successively darker tones the probabilities for two or more (up to 14) species. (b) Relationship between mean total yield from the community and fishing mortality. Grey shading and broken lines denote 50% and 90% uncertainty intervals, respectively.
