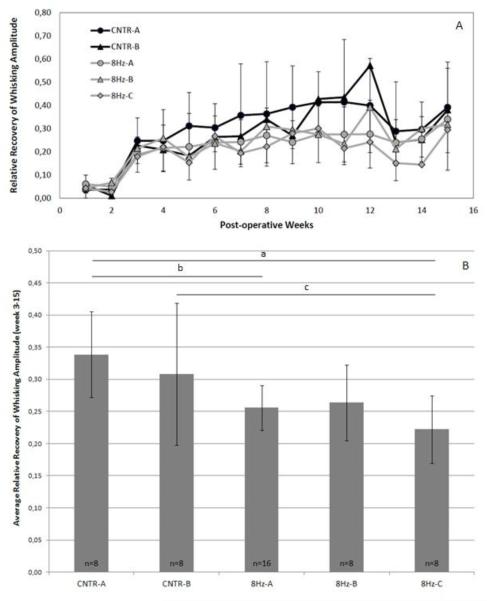
Figure 3.
A. Recovery of amplitude for the 8Hz experimental and control groups during 15 post-operative weeks. Standard error bars are shown. B. Columns represent the average recovery of amplitude across week 3 to 15 for the 8Hz experimental groups. Standard error bars are shown. Horizontal bars with asterisks indicate statistically significant differences (P < 0.05).

