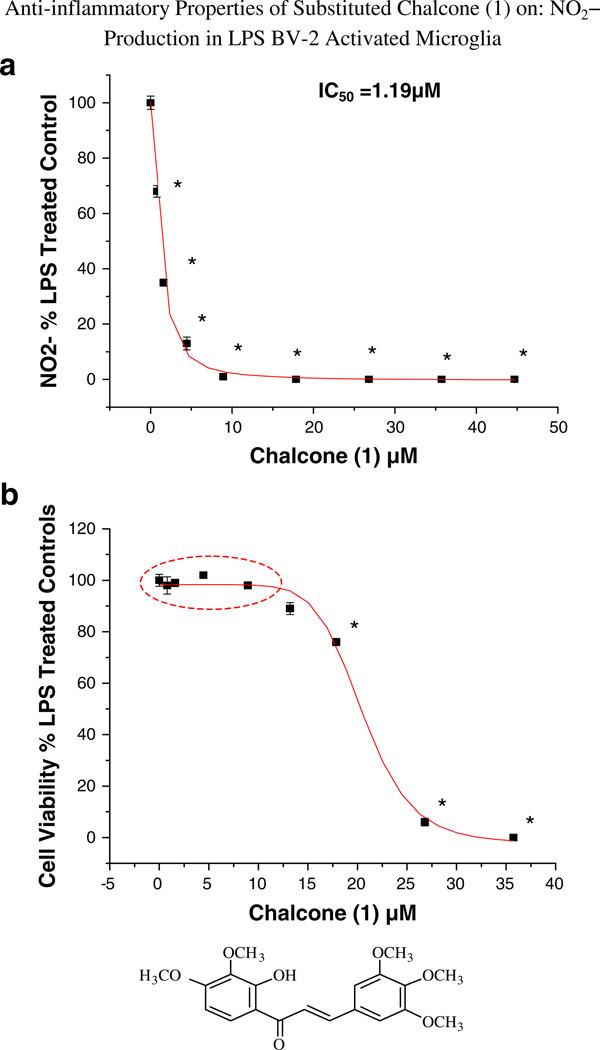
Fig. 2.
a and b The effect of chalcone (1) on NO2− production by LPS-activated BV-2 microglial cells. The data represent NO2− as % control and are presented as the mean ± SEM, n = 4. Statistical differences from the control were evaluated by a one-way ANOVA, followed by a Tukey post hoc test, * p < 0.05

