
Figure 2. DaCld forms distinct intermediates at (A) acidic and (B) alkaline pH following rapid mixing with 3 eq PAA.
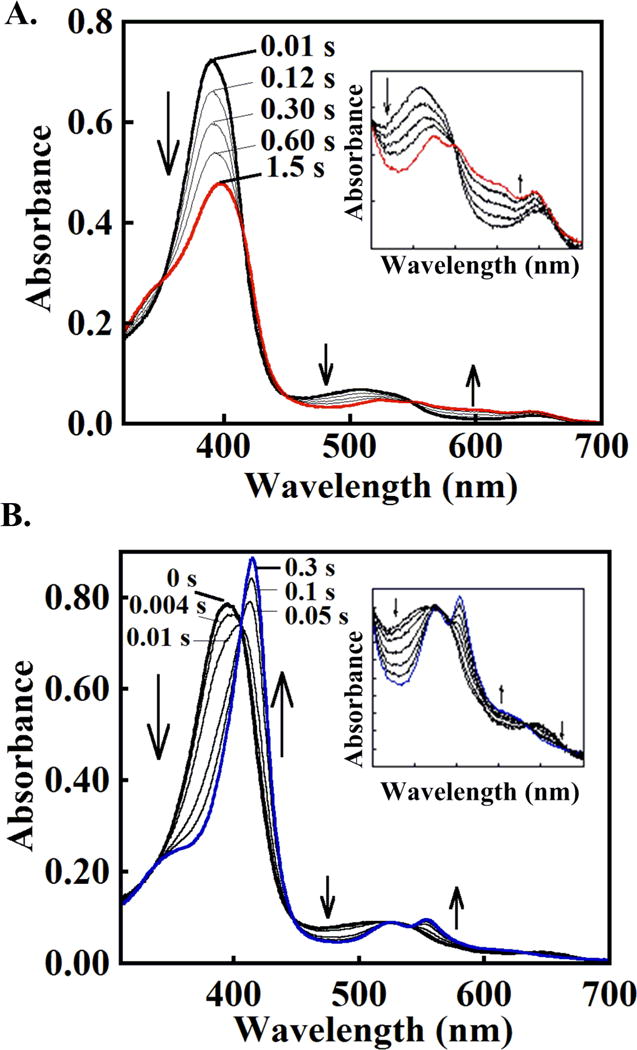
(A) Compound I forms at pH 6. ~15 μM DaCld (7.5 μM final) was mixed with 50 μM peracetic acid (25 μM final) in 0.2 M citrate-phosphate buffer (20 °C). \The initial spectrum is shown in black and the spectrum for the intermediate formed after ~1.5 seconds in red. Intervening spectra measured at the given times are gray. (B) Compound II or [Fe(IV)=O] + (AA▪) forms as the initial intermediate under similar conditions but at pH 8. The initial spectrum is shown in black and the spectrum for the ferryl intermediate that formed after ~300 ms in blue. Intervening spectra measured at the given times gray. Insets: visible bands (450 – 700 nm) shown on an expanded scale.