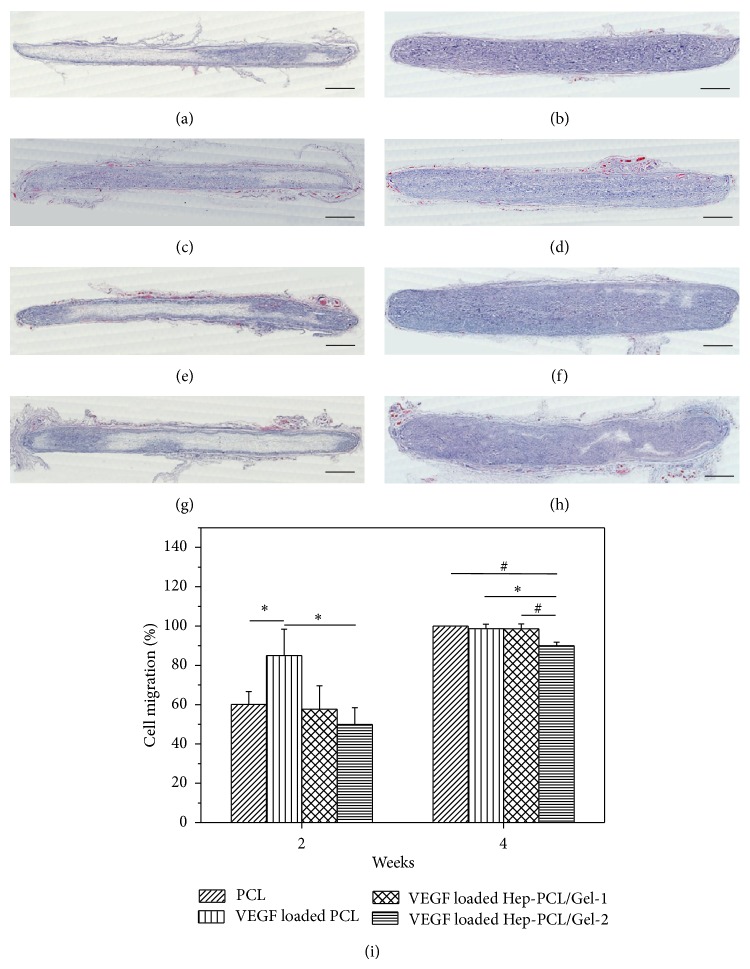
Figure 6.
Representative hematoxylin and eosin (H&E) staining of explanted scaffolds after subcutaneous implantation for 2 (a, c, e, and g) and 4 (b, d, f, and h) weeks (n = 3): PCL (a and b); VEGF loaded PCL (c and d); VEGF loaded Hep-PCL/Gel-1 (e and f); VEGF loaded Hep-PCL/Gel-2 (g and h) (scale bars = 1 mm), and the corresponding quantitative analysis of cell migration (i). * P < 0.05; # P < 0.001.

