
Figure 6.
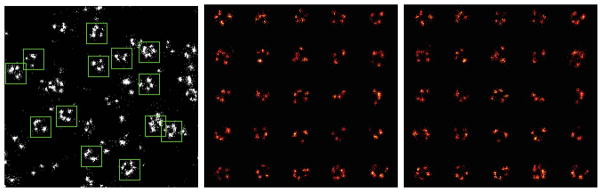
Registration pipeline (all xy-projections). a) A zoom in of the actual localization data. The green squares (size 120 nm) indicate automatically detected regions of interest (ROI) containing NPC structures, b) Cut out from ROIs before registrations, c) The same NPCs as in b) but now after registration.