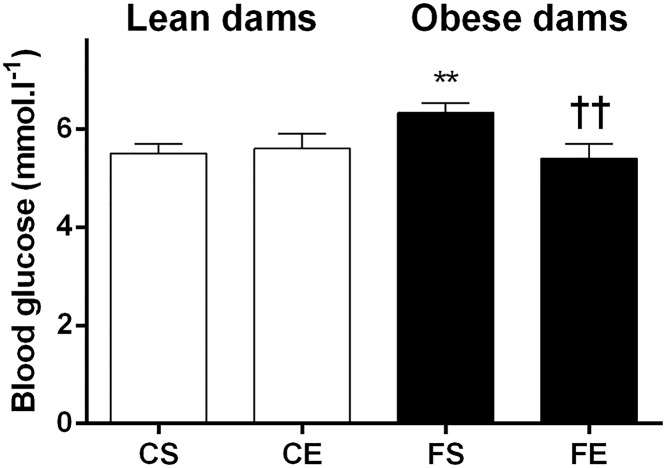
Fig 1. Maternal blood glucose concentration during the lactation period, at postpartum day 12.
Data are expressed as mean ± SEM. The first letter describes maternal diet; chow (C) or HFD (F) and the second letter describes maternal activity; sedentary (S) or exercise (E). Data were analyzed by two-way ANOVA followed by post hoc LSD. **P< .01 maternal HFD effect; †† P < .01 maternal exercise effect.

