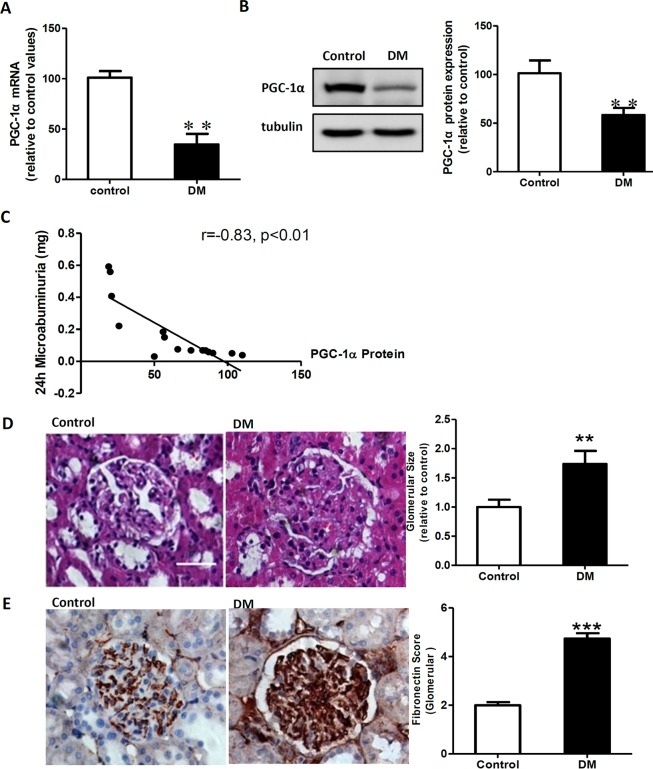
Fig 1. PGC-1α expression was decreased in the kidney of diabetic rats and correlated with renal lesions.
A: Real-time RT-PCR assay for PGC-1α mRNA relative to the control values. B: Western blotting analysis of PGC-1α expression in the control rats (control) and diabetic rats (DM). Equal protein loading was confirmed by staining with the tubulin antibody. C: Result of the correlation analysis between PGC-1α protein expression and 24-h microalbuminuria level. D: Glomerular H&E staining in the control and diabetes groups. Glomerular hypertrophy was obvious in the diabetes group. Original magnification: ×400. E: Immunohistochemical detection of fibronectin (FN) in glomeruli from control and diabetic rats. Data are expressed as the mean ± SD values from 5–10 rats per group, and the experiments were repeated independently at least 3 times with similar results (**P < 0.01 vs. the control; ***P < 0.001 vs. the control). Scale bar: 25 μm.

