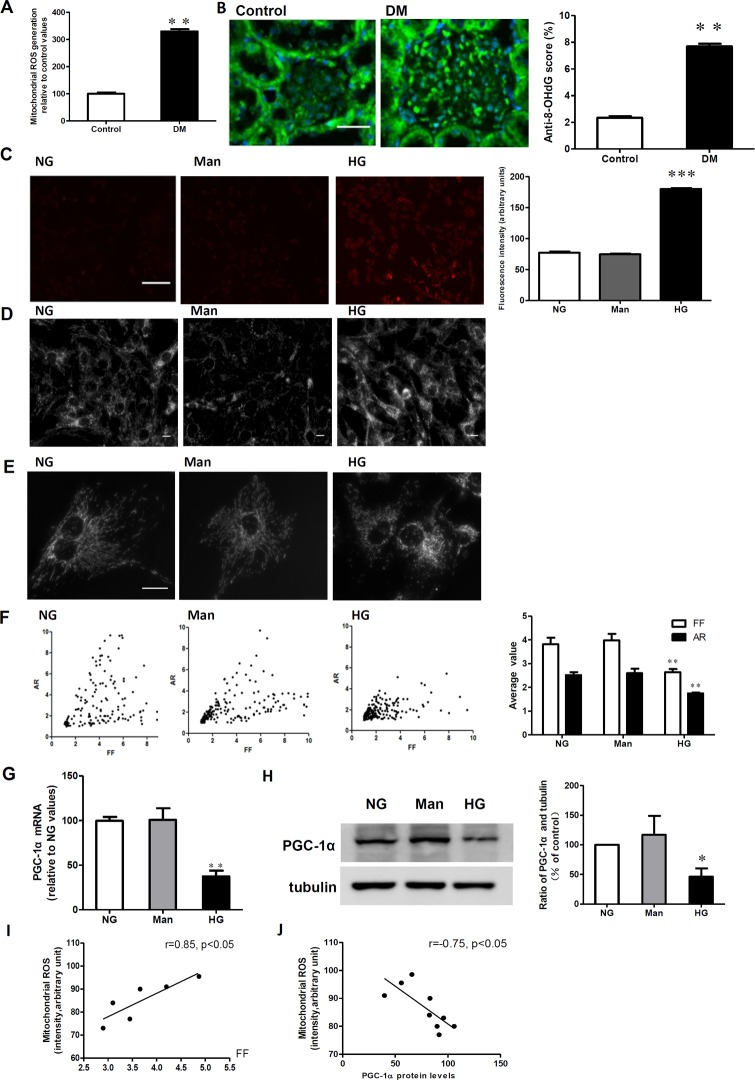
Fig 2. Decreased PGC-1α expression is associated with a hyperglycemia-induced increase in mitochondrial fragmentation and ROS generation.
A: Kidney mitochondrial ROS production in the control and diabetic rats (DM). ROS production was identified by the fluorescent probe Mitochondrial ROS. B: Immunofluorescent micrographs of 8-hydroxy-2-deoxyguanosine (8-OHdG) in the control and diabetic rats (DM). (Original magnification: ×400). Scale bar: 25 μm. C: Intracellular ROS production was determined by the mitochondrial fluorescent probe in RMCs exposed to normal glucose (NG), mannitol (Man), and high glucose (HG). Scale bar: 100 μm. D, E and F: Mitochondrial morphology was determined using the MitoTracker probe in RMCs exposed to NG, HG, and Man. D: Mitochondrial morphology at x200. Quantitative analysis of mitochondrial morphology was conducted using a computer-assisted morphometric analysis application for the calculation of form factor (FF) and aspect ratio (AR) values. Scale bar: 10 μm. G: Real-time RT-PCR assay for PGC-1α mRNA relative to the NG values. H: Western blotting analysis of PGC-1α expression in NG, HG, and Man. I: A correlation analysis between ROS generation and the mitochondrial morphology parameter, FF. J: A correlation analysis between ROS generation and PGC-1α expression. Data are expressed as the mean ± SD values for 5–10 rats per group or three cells per group, and the experiments were repeated independently at least three times with similar results (**P < 0.01 vs. control or vs. NG).

