
Fig 5. PGC-1α suppresses mesangial cell hypertrophy induced by hyperglycemia.
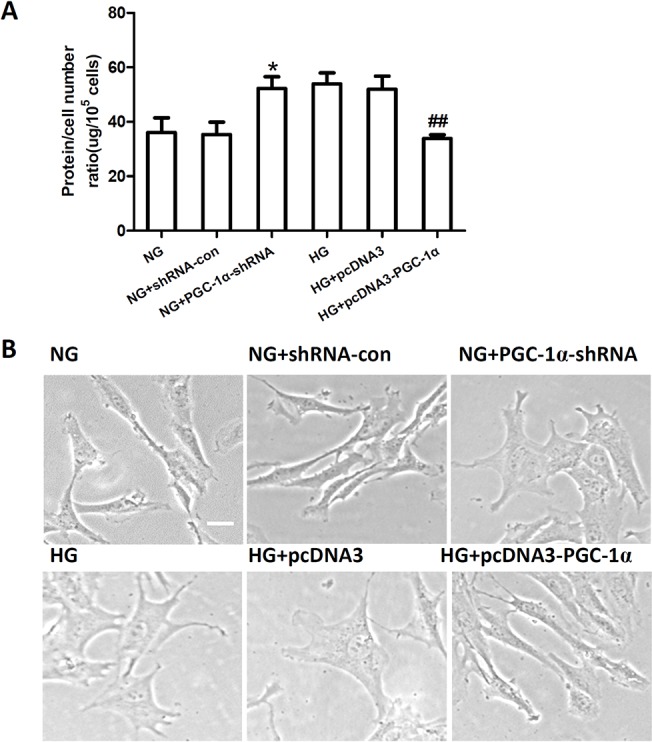
The ratio of total amount of protein to cell number (A) and cell morphology (B) in RMCs incubated in normal glucose (NG) and high glucose (HG) conditions, RMCs transfected with PGC-1α shRNA or shRNA-con under NG conditions (NG+PGC-1α shRNA, NG+shRNA-con), and RMCs transfected with pcDNA3-PGC-1α or pcDNA3 under to HG conditions (HG+pcDNA3-PGC-1α, HG+pcDNA3). Data are represented as the mean ± SD values from three cells per group, and the experiments were repeated independently at least three times (*P < 0.05 vs. NG, ## P < 0.01 vs. HG). Scale bar: 10 μm.