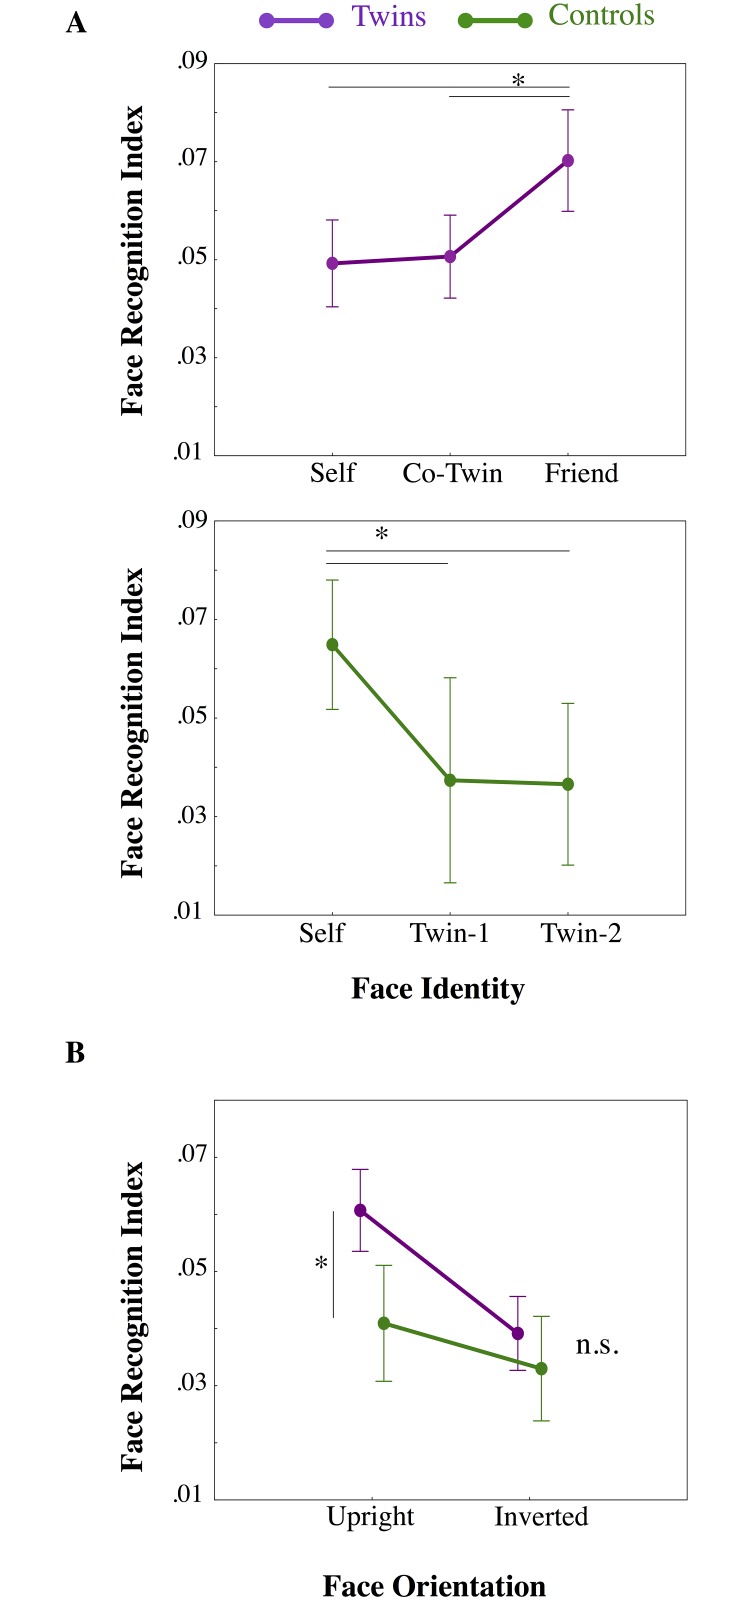
Fig 2. Face recognition indices.
A) Results of separated repeated measures ANOVAs on Face Recognition performance (normalized inverse efficiency scores (IE), y-axis) scores are represented for both Twins (violet line) and Control (green line) participants as a function of observed Face Identity (x-axis). B) Results of mixed-model ANOVA comparing Twins (violet line) and Control (green line) Face Recognition performance (normalized inverse efficiency scores (IE) for mediated Twins faces; y-axis) as a function of Face Orientation (x-axis). Means and standard errors (SE) are represented. Asterisks indicate significant differences from Newman-Keuls post-hoc comparisons.

