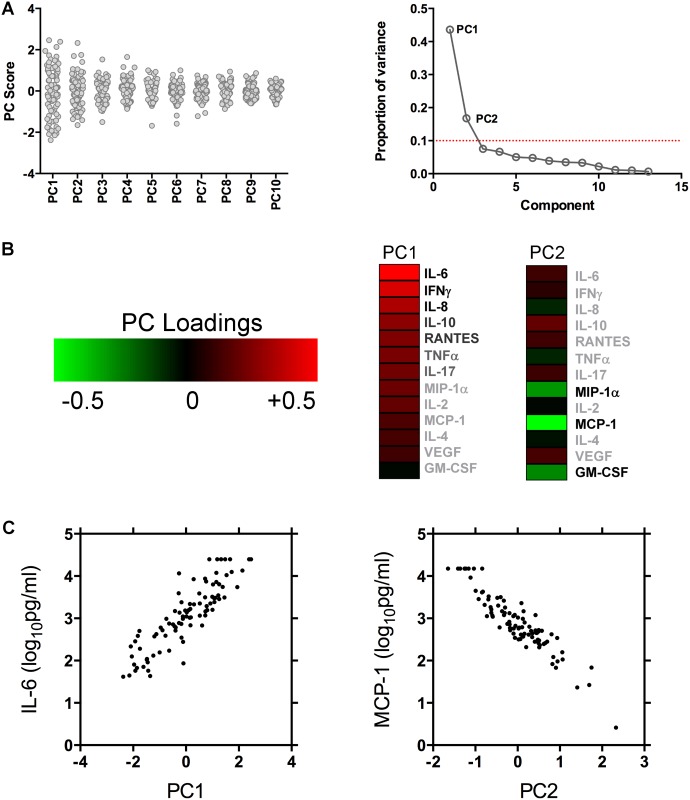
Fig 2. Principal component analysis scores and weightings.
Figure (A) shows the variance of each of the principal component scores amongst the 90 patients studied. Figure (B) shows the proportion of variance in the dataset explained by each of the principal components. The majority of the variance in the dataset was explained by the first two principal components, which were used to explore associations between CNS immune responses and outcome. Contribution of each variable to the variance between patients in PC1 and PC2 is shown in the heat map. PC1 was composed primarily of pro-inflammatory cytokines IL-6, IFNγ and the chemokine IL-8. PC2 contained a heavy negative weighting of chemokines MCP-1, MIP-1α and the cytokine GM-CSF. Figure (C) shows the associations between PC1 and baseline CSF IL-6 concentrations, and PC2 and baseline CSF MCP-1 concentrations. See S2 Fig for more detailed PC1 and PC2 associations.

