
Fig 4. Associations between baseline cerebrospinal fluid immune response profiles and clinical outcome.
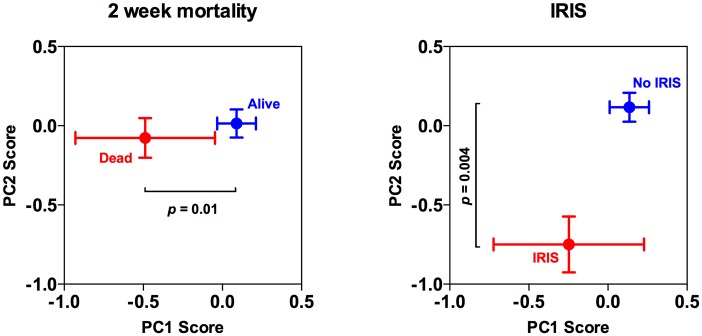
Associations between baseline PC1 and PC2 scores and 2-week mortality and IRIS. The points represent the mean values, with standard errors denoted by the error bars. The adjusted p value are shown, derived from (in the case of mortality) a linear regression model adjusting for treatment group, CD4+-cell count, and the previously described risk factors for mortality, baseline fungal burden and altered mental status; and (in the case of IRIS) a linear regression model adjusting for treatment group, CD4+-cell count, and the previously described risk factors for IRIS, baseline fungal burden and CSF white cell count.