
Fig 5. Relationship between CSF MCP-1 concentrations and CD4 cell counts, cerebrospinal fluid lymphocyte counts, and immune reconstitution syndrome.
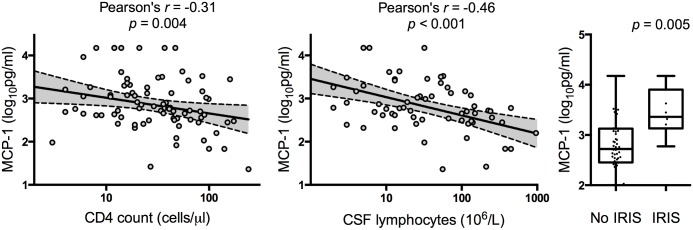
Associations between baseline MCP-1 concentrations and baseline CD4 cell count, concentrations, cerebrospinal fluid (CSF) lymphocyte count and immune reconstitution syndrome (IRIS). The IRIS association was adjusted for treatment group. Best-fit regression lines are shown with 95% confidence intervals. Box plots show the median and extend to the inter-quartile range, with whiskers denoting minimum and maximum values. These associations all remained significant when controlling for a family wise error rate of 0.05.There was no significant difference in CSF MCP-1 concentrations between those who survived (749.1 pg/ml) and those who died (858.4 pg/ml), p = 0.76.